
Polygon and Ethereum
Whenever a magazine or newspaper picks up the topic of cryptocurrencies, the article is usually actually only about Bitcoin. Yet it is only one of many cryptocurrencies. Ethereum, for example, has the second-largest market capitalization after Bitcoin and is technologically far superior to the latter in many respects.
Compared with Bitcoin, Ethereum offers:
- lower transaction fees
- shorter transaction times
- higher transactions per second
- the innovation Ethereum Virtual Machine (EVM), which can execute programmed agreements (smart contracts)
- the innovation decentralized exchanges (DEX)
- the innovation decentralized organizations (DAO)
Ethereum was officially launched on 30 July 2015 – six years after Bitcoin. It is a modern and very popular blockchain. It is the most popular blockchain with smart contracts and the energy-efficient proof-of-stake mechanism.
Nevertheless, using Ethereum is still comparatively expensive. One Ether is currently traded (as of December 2024) at EUR 3,378. If you want to participate in staking or use smart contracts, transaction fees of EUR 12 to EUR 100 can easily apply.
Why Polygon?
This is where Polygon becomes interesting. Polygon POS launched in 2017, around two years after Ethereum, under the name Matic Network. It is a sidechain. This means it is an independent blockchain connected to the Ethereum network via a bridge. It runs in parallel but has its own consensus mechanism. Polygon is compatible with Ethereum and the Ethereum EVM. This allows smart contracts running on Ethereum to be deployed on Polygon almost unchanged. In addition, Ethereum acts as an overarching security layer because ownership of Polygon tokens (POL) can be proven on Ethereum.
Advantages of Polygon:
- transaction fees are usually below EUR 0.01
- low entry costs: currently (as of August 2025), 1.00 POL costs only around EUR 0.21
- many times higher transaction throughput than Ethereum
- using smart contracts may cost at most around two euros
This makes Polygon an ideal cryptocurrency for beginners.
Whitepaper
The whitepaper for POL can be found at polygon.technology/papers . The report introduces POL and describes both the design goals of the token and of the Polygon network. To do so, it compares POL with a range of other tokens such as Bitcoin and ETH. Their specific advantages and disadvantages are discussed in order to explain the background of POL’s design. It also presents underlying assumptions and notes that these assumptions could prove to be incorrect. To reduce risks, an economic model was developed and possible scenarios were simulated.
With the help of POL, the associated Polygon network is intended to grow into a scalable ecosystem that supports many (block-)chains. The higher the number of chains with which the Polygon network can interact, the wider the adoption of POL.
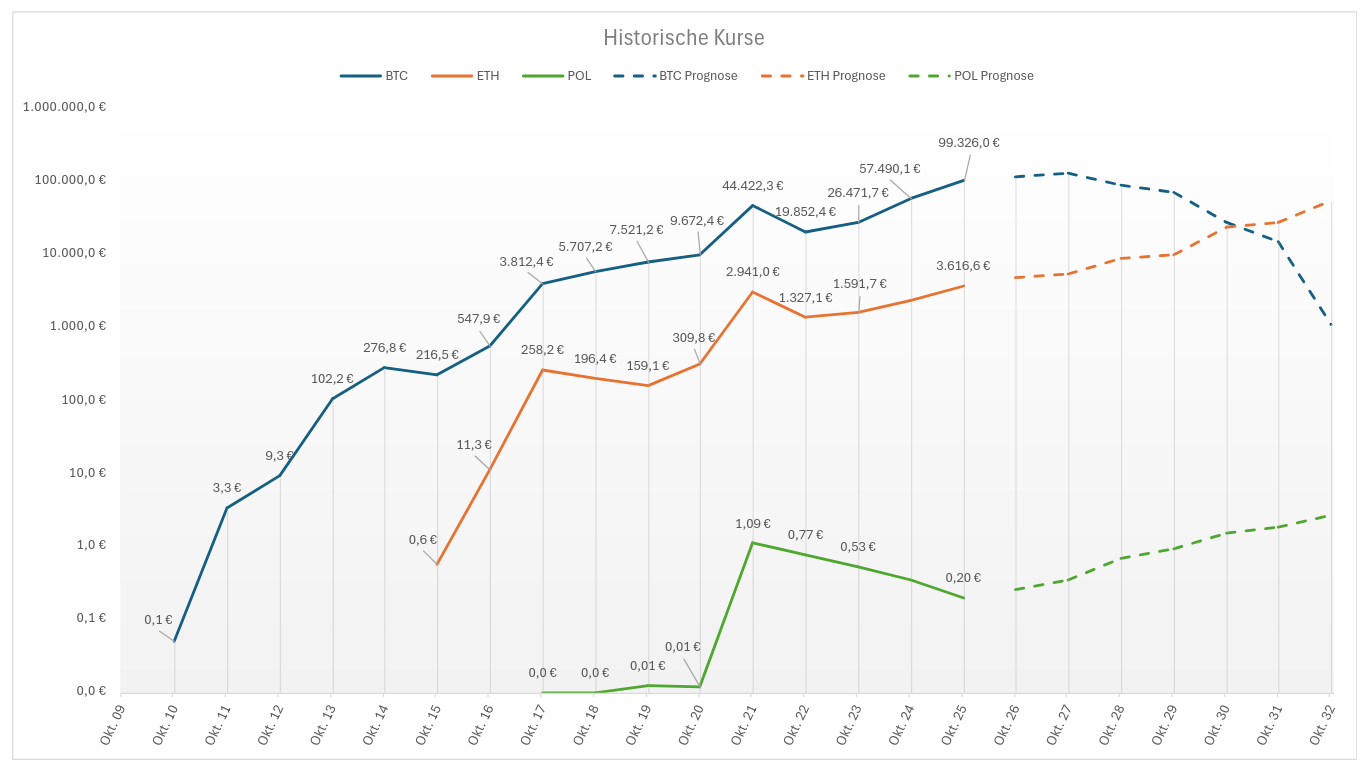
Historical Price Development
In the following chart, you can see the historical price development of Bitcoin (BTC), Ether (ETH), and POL 1. The left vertical axis is logarithmically scaled 2, so that the start and development of Ether and POL remain visible alongside Bitcoin. You can see that Polygon is the youngest network and still has very low prices.

Current Market Development
The Crypto Future
Bitcoin is the pioneer among cryptocurrencies. And rightly so, it is very successful and popular.
Nevertheless, in the author’s view, this blockchain can no longer keep up technologically with its modern competitors. Through its Turing-complete virtual runtime environment, Ethereum offers an unrivalled, global, decentralized financial ecosystem. By contrast, Bitcoin is merely a decentralized payment infrastructure with limited applicability. This raises the question of what actual added value Bitcoin provides to its users. Payments via PayPal or Wero are faster and often cheaper, especially for everyday transactions.
According to the author’s private hypothesis, Bitcoin will sooner or later be replaced by Ethereum – and thus also by Polygon. Bitcoin has a lot of past and little future. With Polygon, it is exactly the opposite.
Let’s take a look into the crystal ball. How might prices develop?
The median price on 1 October of each year was recorded. Therefore, prices between the recorded points in time, for example a Bitcoin price of EUR 10 in May 2011, are not shown. ↩︎
Logarithmic scaling means that the distances on the vertical axis are not evenly spaced (1 EUR, 2 EUR, 3 EUR, …), but increase tenfold at each step (1 EUR, 10 EUR, 100 EUR, …). As a result, the price curves are strongly compressed. ↩︎